We're building something new – take a look at the beta site: intglobal.com
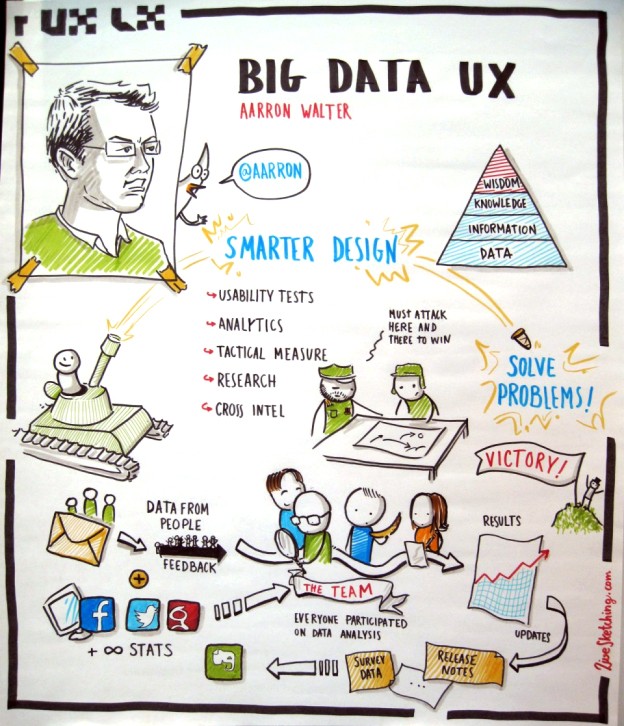
In 2018, it almost sounds repetitive to say that user experience trumps features, and designing a better product depends on understanding what it feels like to use it, and best to design a product that can be used intuitively. Intuitive user experience and a great product depend on a number of things including great design. However, there is something far more important and basic than design, which is data.
Data in the form of customer feedback, customer expectation and motivations, system performance and errors, and the ability to make sense of data is collected over weeks, months, and years in the right context is what helps develop great products and superior UX. Yet, data is often ignored or given just lip service simply because product designers and developers do not have the resources or interest to process complex datasets concerning customer feedback and expectations.
Let us admit it. Customer feedback, surveys, and reviews build up over a period of time, and most companies simply toss the accumulated data to the side, quite literally. Yet, it is this very data that is needed to create better experiences and better products.
Why the reluctance to use data when it is so freely available?
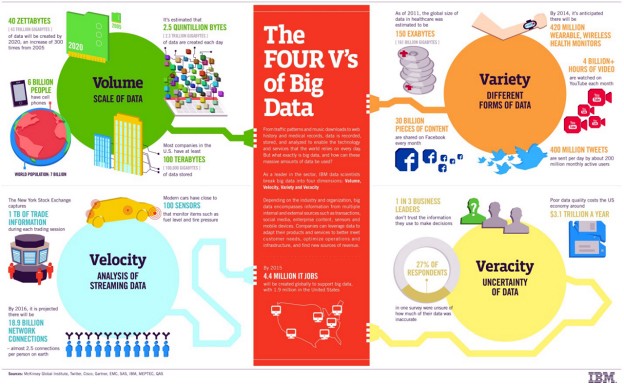
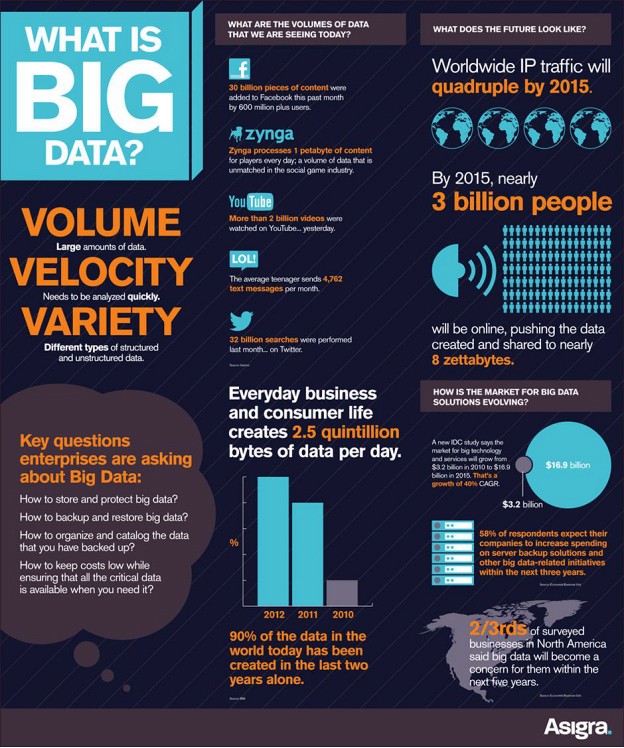
Every business gathers data, even if they do not realize that they are. However, most companies are reluctant to use the data that is already available on their systems. This data may stem from customer feedback forms, web traffic figures, purchase trends, social media conversations, and just about anything that results due to the intersection of business, customer, and the product. The reluctance stems from distrusting data and feeling overloaded by data that is continuously collected by systems.
With many products being “intelligent”, data overload has led to data daze, as a Forbes article puts it. The same article describes data daze resulting in analysis paralysis. The answer is simple. Most companies hesitate using data or downrightly avoid anything remotely related to data because they feel paralyzed by it. How can a business avoid this state of data paralysis, and confront it to make it something useful?
While distrusting the quality of data and feeling overwhelmed by data that is available is natural, so is feeling paralyzed by over-analysis of data. The truth is, no company can process all the data that it collects. It needs to know what it wants to know with data that is already available, and how it is going to process it. This brings us to the question of processing and placing data in meaningful contexts.
How to place data in meaningful contexts
When it comes to understanding and using data, context matters more than anything else. Cognitive overload of information results in inefficient use of that information. For example, a boy that is given a dozen books on his birthday may not value them, or even feel intimidated by them, even if those books are classics. However, if he learns to categories those books in a shelf, or is helped to do so by someone who understands those books, he will not only pick up those books, by also put to use what he learns from them.
Similarly, every business must put the data that they collect into context. Without placing data in context and simply processing it using analytical tools will result in an analysis that may not be relevant at all, resulting in analysis paralysis. With the Internet of Things, location-based applications, wearable tech, and sensors contributing to the data deluge, one must really know how to place all that data in context. While this may seem difficult, it is not impossible. Ask yourself these questions:
As you can see, asking yourself or other C-level executives in your company will help you to develop a frame of reference with which you can handle data. Once you know what you are looking for, it is easier to find it. Usually, you can find all these answers with the assistance of your customers plus with a little help from your friends (IT department and technology).
3 important sources of data to develop better products and UX
As you might have learned to question yourself in the previous section, the answer to your data quandary lies with your customers and your IT department.
6 steps to developing great products and user experience, using data
Understanding who uses your products is key to contextually placing data and deriving insights from it. To understand your customers, create customer profiles, also known as customer personas. Based on the behavior of these personas, you can derive insights regarding how your product can be improved in future.
With necessary permission, you can begin to collect data from users, so that they can be used and reused. Ethical collection of data is important, which means, you will need to specify what kind of data is collected, and for what purpose. Collecting usage behavior data to improve product user experience is a standard affair.
Once you collect data that is required, understand the context in which you want to use it. This context could be improving a certain feature of your product, developing a new product, or providing better customer service. It really depends on your goals and product development strategies.
Whether your product is an app or an IoT-enabled device, there will always be some kind of data that is continuously churned out. Use machine learning to learn from the data patterns and put that into future use. Machine learning can be integrated with predictive analysis to derive rich insights.
Using predictive analysis and other computational tools to derive rich insights from your data will help you to understand what your customers want, and which bugs need to be fixed. Use this information to develop a new product or make improvements to the existing one.
Making improvements to user experience and enhancing product features are ongoing processes. Collecting data continuously and deriving rich insights helps to fix bugs in a timely manner, ensure that the user experience is intuitive and that all necessary features are added as per customer feedback.
Don’t feel paralyzed by analysis. Embrace data.
Analyzing customer feedback, their expectations and motivations, system performance logs, and other kinds of data helps in creating better user experiences and products. Most importantly, rich insights derived from data help create intuitive products and intelligent design that go a long way in meeting customer expectations. If you look at data as a tool that will help you, instead of feeling paralyzed by all the analysis it can fetch you, you will be able to conquer the market you are in.