We're building something new – take a look at the beta site: intglobal.com

The fundamentals of augmented analytics are pretty straightforward. Gartner’s definition from its IT Glossary is as follows:
“Augmented analytics is the use of enabling technologies such as machine learning and AI to assist with data preparation, insight generation, and insight explanation to augment how people explore and analyze data in analytics and BI platforms. It also augments the expert and citizen data scientists by automating many aspects of data science, machine learning, and AI model development, management and deployment.”
A big part of augmented is also Natural Language Query/Processing (NLP/NLQ) and Natural Language Generation (NLG) that creates dynamic narratives to describe what’s happening in your data.
AI means Applied and Invisible
For augmented analytics to progress, it needs to be fabricated with your data and analytics regimen program. That means the system will offer you recommendations, make the complex easy, suggest options you hadn’t thought of. It may be a dream for many, yet for others, it’s sort of a “black box”—they need to be aware of what’s happening around at each and every stage. These divergent opinions mean that adoption (and acceptance) will take time to mature. It needs to apply yet it will stay invisible to the users.
From Data to Insights to Actions
Analytic workflows start when the first bit of data is captured to when action is taken to achieve your desired outcome. That’s a pervasive flow that incorporates everything from data management through business applications.
Augmented analytics plays a major role in the complete process.
At many industrial firms, the aging workforce is starting to become a big concern, said Heena Purohit, senior product manager for IBM Watson IoT. “Companies are now looking for innovative ways to retain their tribal knowledge and expertise, and augmented intelligence is helping them in this pursuit,” she said.
One Australian oil and gas company had this augmented analytics feature absorb 30 years of engineering and drilling knowledge to help technicians tap into it to make fact-driven decisions about complex projects.
“Using this solution, technicians and operators reduced the time spent finding data by 75%, which translates to a $10 million savings in employee costs because of faster access to information and more intuitive analysis of engineering records for the organization,” Purohit said
Another instance includes Adobe which built a machine learning tool called Segment IQ that offers a button-click comparison of two groups of customers and compares them across hundreds of different dimensions. It’s a common analysis outside of machine learning, but one which takes teams months or years to do. Having that tool available makes it possible to confirm or refute intuition-based hunches from leadership on the fly.
So, how will augmented analytics evolve? In our opinion, it will follow a typical Capabilities Maturity Model (CMM) six-stage progression:
Augmented Analytics Evolution:
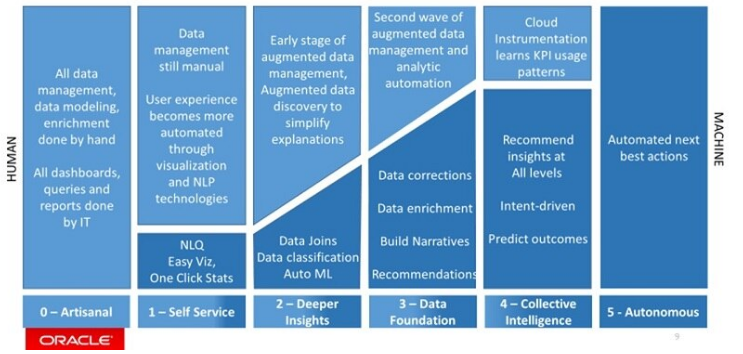
Source: Business Insider – Oracle Corporation
Level 0 – Artisan: Everything is hand-crafted, much like it has been for decades.
Level 1 – Self Service: Data management is still largely manual, but the human interaction with data will be enabled with Natural Language Query, one-click statistics for easy forecasting, outliers, etc. and recommended visualizations based on the type of data.
Level 2 – Deeper Insights: Early stages of augmented data management appear (recommended sources, joins, crowdsourced suggestions, smart cataloging), and augmented discovery uncovers insights that do the heavy lifting, so you don’t have to.
Level 3 – Data Foundation: The second wave of augmented data management begins, with corrections, and enrichments. Analytic automation hits its stride with narratives at every level—a visualization, a canvas, a data set.
Level 4 – Collective Intelligence: The system becomes instrumented and learns patterns of metrics and key performance indications (KPIs) that alert when conditions need attention. These are both business KPIs and system KPIs. Insights become pervasive, business intent goes from an idea to a reality, and outcomes are predicted, actions are recommended—but humans still take the action.
Level 5 – Autonomous Action: Everything truly becomes data-driven, with the next best actions executed based on predictions, insights, and intent. The system is the engine of change.
The analogy of this is autonomous vehicles. Smart capabilities gradually extend to assist the driver, expanding over time, with the eventual goal that the “driver” is the machine. While we are a long way from “driverless” completely controlling data and analytics, there are situations where it already exists:
Real-time offers that are served up automatically to buyers online, all driven by rules and algorithms.
Programmatic trading in investments, where algorithms trigger buys and sell orders to public markets.
Self-tuning, self-managing databases, as in Oracle Autonomous Data Warehouse, that automates many activities.
Like any maturity progression, it’s not always a strict “step by step”. You may adopt capabilities in a different order or choose to bypass some capabilities all-together. So, no worries if this doesn’t reflect your current journey or future plan.
What do you think?
We’d love to hear your ideas about Augmented Analytics maturity. Do you agree? Have a difference of opinion? We’ll continue to refine this over time, with your input along the way.